I know. I said I’m not doing winter outlooks anymore. Well, I say a lot of things. Why start following through on the them now?
The reason I bagged winter outlooks is simple: I felt that for the Northeast mountains, winter outlooks don’t really predict anything. My intuitive sense after doing years of outlooks and studying the snow in the N/E mountains was that the macro weather patterns we can predict with decent certainty in the fall, don’t actually correspond to the amount, frequency, or quality of snow we see in the winter. Sure, ENSO states (which is about all we can predict with certainty) might correspond reasonably well to the temperature in Boston, or the amount of rainfall in Philly, or most likely the amount of snow in California, but does the ENSO state really lead to more or less snow in Vermont? Or the ADK? Or the Whites?
After talking about it with Greg, who is a) a bigger math nerd than I am, and b) a fan of winter outlooks, we decided that best winter outlook would be a re-analysis of the above hypothesis merged with a discussion of the current ENSO state. This follows on the heels of Greg’s EXCELLENT re-analysis of the yearly average snowfall on Mt. Mansfield.
So here we go.
ENSO. What is it? ENSO stands for El Niño/Southern Oscillation and it is a global weather phenomenon. As exaplained by NOAA’s Climate Prediction Center (when it’s not closed):
The term El Niño refers to the large-scale ocean-atmosphere climate phenomenon linked to a periodic warming in sea-surface temperatures across the central and east-central equatorial Pacific (between approximately the date line and 120oW). El Niño represents the warm phase of the El Niño/Southern Oscillation (ENSO) cycle, and is sometimes referred to as a Pacific warm episode. El Niño originally referred to an annual warming of sea-surface temperatures along the west coast of tropical South America.
NOAA’s Climate Prediction Center, which is part of the National Weather Service, declares the onset of an El Niño episode when the 3-month average sea-surface temperature departure exceeds 0.5oC in the east-central equatorial Pacific [between 5oN-5oS and 170oW-120oW]. (CPC)
La Nina, is essentially the inverse. It’s the “periodic cooling of ocean surface temperatures in the central and east-central equatorial Pacific that occurs every 3 to 5 years or so.” (Id.)
The hell does that have to do with the Northeast? (good question, see paragraph 2 supra). Generally, the basic concept is that the state of the equatorial pacific influences global weather patterns through a complex chain link of interactions. I’m simplifying but, warm sea water influences greater tropical convection and rainfall. The enhanced cumulonimbus convection affects the wave pattern in the upper atmosphere. Think about it like a rock being dropped into a pond only upside down. The convection enters the upper atmosphere and alters the natural wave state. The expanding “ripples” don’t make it that far but the energy produced has global influences in a wave pattern that when acted on by the earth’s rotation and naturally occurring jet streams results in fairly stable repeating patterns of highs and lows across the world. (Seriously, read more) For anyone who knows anything about partial differential equations, the ENSO state is a broad initial condition that increases the probability of one of a small(er) set of forward-difference “attractor” solutions.
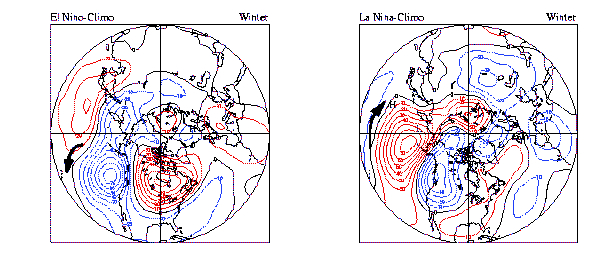
Generally these are the wave patterns over Nor. America:
So what is the ENSO state?
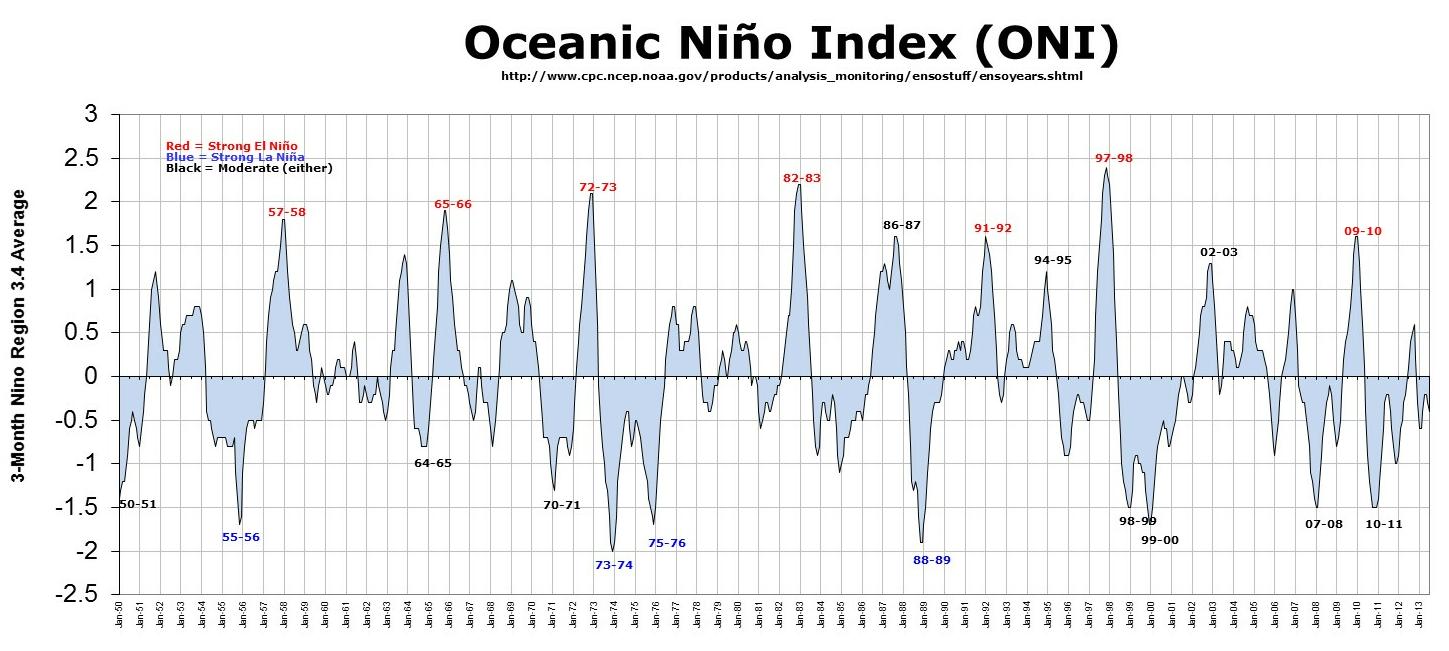
Currently SST departures for the critical Nino 3.4 region are at -.2C which places the ENSO state squarely in the “neutral” range. Current three month running Oceanic Nino Index (ONI) for 3.4 region is -.5 which is the border of La Nina.
During the last four weeks, SST’s were below average in the eastern pacific and above average in the western pacific with the anomalous value of these SST’s weakening (moving towards average). The slope of the thermocline (thin boundary of water separating upper ocean from deep stable ocean) can be used to signal the approaching enso state. It’s flattest before warm episodes, and steepest before cold episodes. Currently it’s in the middle of ranges. This further indicates that we are heading for ENSO neutral conditions.
The CPC’s Probabilistic ENSO outlook for september mirrors this real data and gives us a 60% chance at seeing ENSO neutral conditions, a 25% of seeing La Nina conditions and a 15% chance of seeing El Nino conditions develop for the December, January February time period. (Similar chances for NDJ and JFM). The International Research Institute for Climate sees ENSO neutral conditions persisting with equal chances for the ONI to persist around -.5 (its current state) and +.2.
Last year we were in a generally neutral pattern after two years of moderate La Nina conditions:
But again, does the ENSO state matter? Well maybe.
After a great saturday hike and a few beers Greg and I decided to find out.
First we compiled data on the annual snowfall on Mt. Mansfield, the average ONI for the snow season, the average ONI for December, January, February, the average ONI for November – April, the January, February to March NAO. We also decided that “annual snowfall” didn’t really tell us whether Mansfield had a “good” or “bad” year. We figured it’s not the total snow that Mansfield gets that makes or breaks a year. Rather, at some level, it is the frequency of new, large(ish) snowfalls. The idea being that if it were to dump 3 feet three times a year and do nothing in between that wouldn’t really make for great skiing. Sure there would be three great weekends, but rock-hard ice in the interlude. Contrast that with a winter where it snows 6+ inches a dozen times. In the latter, you’re getting frequent powder skiing and a stable, building snowpack. So thus we went back through the Mansfield data and determined the number of 6-inch+ snowfalls for all the winter seasons.
With all that data we next ran some comparisons.
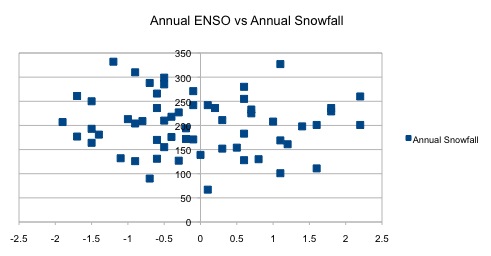
First we compared the ENSO to the annual snowfall.
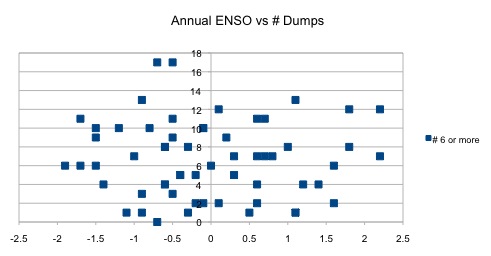
ENSO to frequency of dumps
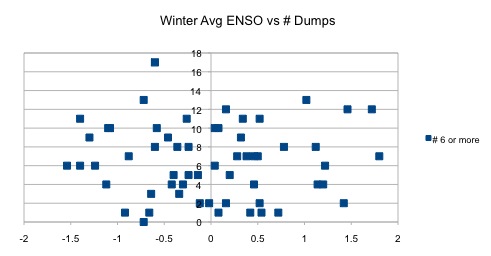
Then we broke it down a little more and did the DJF ENSO v. number of dumps
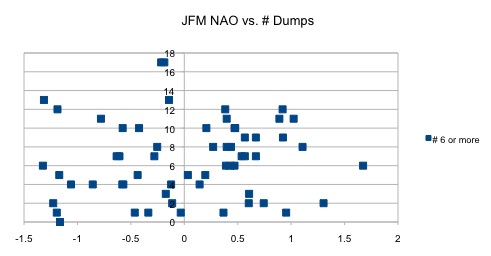
Going a different direction we then took the average NAO values for the winter and compared that to the number of dumps
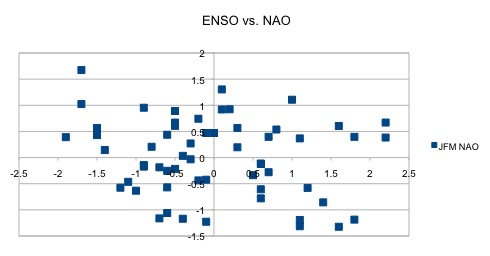
Then of course we looked to see the comparison between NOA and ENSO
So what does this tell us?
First it seems that there isn’t a direct correlation between the ENSO state and either the total snowfall on Mt. Mansfield or the frequency of snowfall. That alone is a fairly significant conclusion (albeit one that would need more research to conclude with authority). Just about every winter-outlook you read relies on the ENSO state…what our data shows is that the ENSO state may be afforded too much credit.
There does however seem to be some “sweet-spot” towards a weak La Nina. It looks like if a borderline La Nina develops, the probability of favorable snow conditions in Vermont increases.
However, there doesn’t seem to be a correlation for other ENSO states. What we are likely seeing is some third variable at play. Something we haven’t figured out yet; something no one has figured out yet.
Second, the NAO state doesn’t need to be very negative to produce active winters or deep winters. Many people are trained with the mindset that big negative NAO anomalies mean big winters. That may be true in Boston or New York, but it doesn’t seem to be true for Mansfield. However, our data shows that’s not true. Middle of the road NAO values are fine.
These conclusions make some sense when we look at the the prevailing weather patterns associated.
If we go back to the chart above (i’m simplifying what that chart means) we see that in an La Nina year, there is generally low 500mb heights ( representing cooler than normal air) over the Great Lakes and a above average heights (warmer air) over the southeast. In El Nino years, there is generally a large high pressure over the northern center of country and trough-y below average heights in the west and southeast. The boundary between these regions is by and large the favored locations for storms. It sets the storm track if you will. Thus in a La Nina year, the storm track is closer to Mt. Mansfield than it is in an El Nino year. Maybe what we’re seeing is that borderline weak La Nina’s set that boundary juuuuuuuust over Mt. Mansfield. El Nino’s maybe place the boundary too far south. Think 2009-2010. It snowed like 100 inches in Philly and 100 inches in DC. It was fine winter but nothing incredible on Mansfield (6 6+ snows, 202+ total inches).
A similar reasoning applies to the NAO state. In a big negative NAO anomaly, there can be a deep cold pool over the northeast that drives the storm track south of the mountains. (See the suppressed winter of 2009-2010) and thus it makes sense that Mansfield sees the most active and profitable winters when the NAO hovers in the slightly negative range. Or at least when the NAO transitions from deeply negative to positive and back again as our best chances for big snows usually come with NAO transitionary phases. Sadly you can’t really predict the NAO very well with anything more than a few weeks lead time.
So what does that mean for our winter?
Well it means that with a trend towards ENSO neutral conditions, and a number of models favoring ENSO neutral/slightly negative conditions, there is a favorable signature going forward for an “average” winter. The mean for all ENSO neutral winters data is about 5-8 6+ snowfalls and around 200 inches at the stake with a maximum average snow depth in the mid-80s. I’m not saying we’ll see an average winter because of the ENSO state. Our research shows that there isn’t a direct relationship, and trying to peg what the probability of any given winter based on ENSO is non-conclusive. Rather I’m saying that for some reason, when the ENSO state is neutral, Mt. Mansfield historically has had “average” winters.
[Once the goddamn government starts working again, I’ll get you some temperature composite anomaly data to compare these years]
Now, I could try to slice and dice years to find two or three comp years. For example, September has seen below average temperatures – so I could try to find ENSO neutral years with cool septembers. Or I could find years that matched other teleconnections (QBO peak, -NA), +PNA, -EPO)…but the more you slice and dice, the smaller your sample size, the more likely anything that happened in your chosen year(s) was simply due to chance.
So, while ENSO doesn’t have a great degree of correlation, the best we can say, is based on the data we’ve looked at, there are favorable signs heading into winter 2013-2014 for average snow depths on Mt. Mansfield and average activity level.
We’d like to continue this research with snowfall data from other N/E mountains – like Mt. Wash, the ADK, and anywhere else we can get reliable data from. We need to expand the sample size and get a broader picture for what is happening at other mountains before we reach any solid conclusions vis-a-vis the correlations between ENSO/NAO/N-E Mountain Snows. Next summer we probably will. But in the meantime, don’t forget what they say about winter in the arctic: it’s gonna be cold…it’s gonna snow…it’s gonna be windy. Duh. A lot of our favorite places to ski are effectively in the arctic due to altitude:latitude conversions. That should tell you something.
27 Comments
Leave a Reply
|
|||
| Home |





Jake
wrote on October 9th, 2013 at 8:47 amWait… So big powder at Magic?
JJ
wrote on October 9th, 2013 at 9:24 amUgh… Bullets?
Greg
wrote on October 9th, 2013 at 10:33 amdidnt you see the target practice sheets here:
Dwayne
wrote on October 9th, 2013 at 11:08 amUnlabeled axes!?!?! My eyes are bleeding!
Dwayne
wrote on October 9th, 2013 at 11:10 amIn all seriousness, though, I LOVE seeing this kind of analysis – can’t wait to see if there is better correlation for other locations or other variables. Bravo sirs!
“Let the data set you free!”
Greg
wrote on October 9th, 2013 at 1:14 pmagreed. horizontal is always ENSO or NAO (desired predictor), and vertical is always snowfall (desired dependant)
Greg
wrote on October 9th, 2013 at 1:17 pmbut yes, they could/should have been labelled more clearly
Dwayne
wrote on October 9th, 2013 at 1:24 pmWho doesn’t love seeing dumps as a unit of measure!?!
Greg
wrote on October 9th, 2013 at 9:15 pmno one! (for the record, we believe this is the first time this variable has been extracted from the mansfield dataset)
SteveO
wrote on October 9th, 2013 at 1:43 pmTry using EPO state versus snowfall, the correlation is pretty clean
Greg
wrote on October 9th, 2013 at 9:15 pmsnowfall where?
Lionel Hutz
wrote on October 10th, 2013 at 5:59 amI’ve thought about it, but the EPO (or Ep-NP) is widely regarded as a spring-summer-fall pattern- no? Doesn’t winter’s general overall effect on the pacific jet stream kinda muck up the EP-NP effect as we move into winter?
Nonetheless, I’ll add in version 2.0
Greg
wrote on October 10th, 2013 at 11:38 amAnd just to be sure this is clear: we’re not trying to be, nor are we, the Voice of God here. We’re happy to update this with other ideas as we come to know them/they become available. So please share any work you’re doing if you want to collaborate!!
And also, we’re not looking to just grab clicks with some map with dark purple colors saying “epic winter brah.” If anyone wants wants to see a map painted in every shade of Weather Channel Purple to make them feel better about winter see crap like this. This is very much NOT THAT… We’re not meathead idiots… we’re Famous Internet Skiers :D
Lionel Hutz
wrote on October 10th, 2013 at 6:04 amOh and what’s the lead time for EPO forecast?
One of the things we were expressly trying to address was the concept that the one index we have some degree of accuracy in predicting long range- ENSO – wasn’t really tied to snowfall.
dobby
wrote on October 9th, 2013 at 11:31 pmGoddamn this is like crack. So technical, so formally exciting….my meteorological muses…how you delightfully glide upon the precipice of pure raw emotion and scientific salaciousness…
I am proud to ride among you…and This.
Happy Totally Average Winter!!!
dobby
wrote on October 9th, 2013 at 11:36 pmI’ve never done crack. Some idea what the high may be like, but not a crack smoker. Just to clarify.
Greg
wrote on October 10th, 2013 at 11:34 amwelcome to the ride! ditto btw
neufox47
wrote on October 10th, 2013 at 10:10 pmThere were really years where Mansfield had 0 or 1 6″+ snowfall?!? Are you sure? Say it ain’t so!!
Greg
wrote on October 11th, 2013 at 1:07 pmas recorded by the engineers at the transmission station… yes.
remember though, they frequently record very low amounts when we all know how deep it was… there’s been lots of vas-deferens-deep photos on FIS from days they reported 1-2″ up there
neufox47
wrote on October 15th, 2013 at 11:33 amGreg – Do you know how they are measuring? Only changes to the snow stake depth rather than using a slated box that gets rid of some wind variation, etc?
Greg
wrote on October 16th, 2013 at 8:09 amcurrently they use an honest to god precip can ala the MWO. not sure how far back that protocol goes. I bet Scotty B. knows.
Peter
wrote on October 15th, 2013 at 6:35 amthis is my happy place
Anonymous
wrote on October 15th, 2013 at 11:05 pmSucks the Govt has shut down the correlation sites but EPO being negative, ala ridging in AK is being forecasted by the European Seasonal Model which correlates to cold and snow 84% of the time in the main winter months. Which means more awesome powdah shots from you guys seems likely.
Greg
wrote on October 16th, 2013 at 8:08 amridging in AK is always good for us (at least temperature wise)
Greg
wrote on October 16th, 2013 at 8:08 amso… “like”
Charles
wrote on October 21st, 2013 at 3:42 pmWould love to see this research expanded as well to other locations… these stations would be on my hit list(arguably biased to where I like to get gnar on the shred stick).
Station JAYV1 located 44.938, -72.505 – Jay Peak – Vermont
Station NCKN6 located 43.661, -73.896 – Gore Mtn. – New York
Station BALV1 located 43.133, -72.766 – Stratton – Vermont
Station RUTV1 located 43.625, -72.978 – Killington – Vermont
Station MMSV1 located 44.533, -72.833 – Stowe – Vermont
Station CPKN6 located 42.1, -73.533 – Catamount – New York
Station TOPN6 located 42.230, -74.438 – Whiteface – New York
Station KINM1 located 44.95, 70.15 – Sugarloaf – Maine
Station PERV1 located 43.266, -72.9 – Bromley – Vermont
Of course inclusion would have to be dependent on how many years of snow data are available so the data record would be the same length for each station, to ensure stable statistics. Some might argue a short(10-20 years) data record may not be good enough to get meaningful statistical information. Which for some stations maybe pushing it, maybe not. I’d have to double check the service records/commissioning information for each(if any) to see what was available.
Lionel Hutz
wrote on November 5th, 2013 at 6:11 amCharles-
Hit me up via email through this site. I’d like to discuss these sites with you.
-Lionel.