TR: An Unlikely Start to the ’11-’12 Season
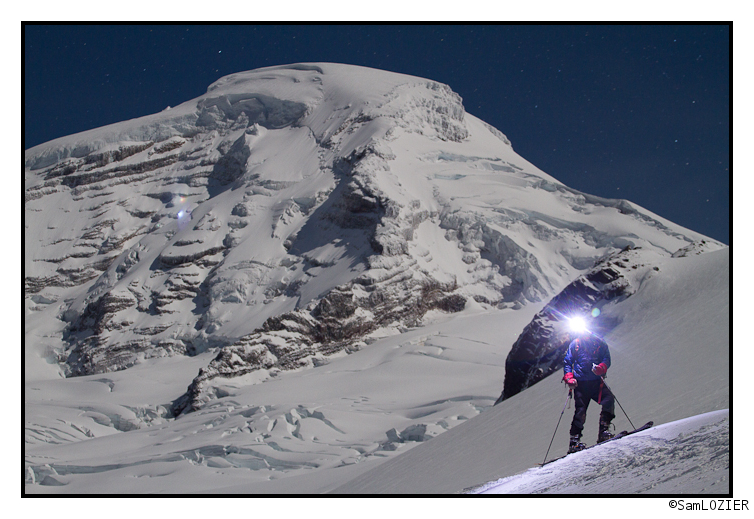
The ’11-’12 season is off to a great start here in the PNW with some beautiful middle of the night moonlit powder skiing.
2011 – 2012 Winter Outlook.
Well the time has come for the LionelHutz official 2011-2012 winter outlook. I put a lot of work into this and I hope you enjoy it.
So let’s get right down to it with some opening remarks about the overall prevailing conditions I expect to see. I’m going to consider three major large scale conditions, La Nina, the NAO, and the PDO. These are macro weather patterns that effect the entire country’s weather (and in truth much of the Earth’s weather) and therefore must be examined in order to make a reasonable winter outlook.
1. La Nina
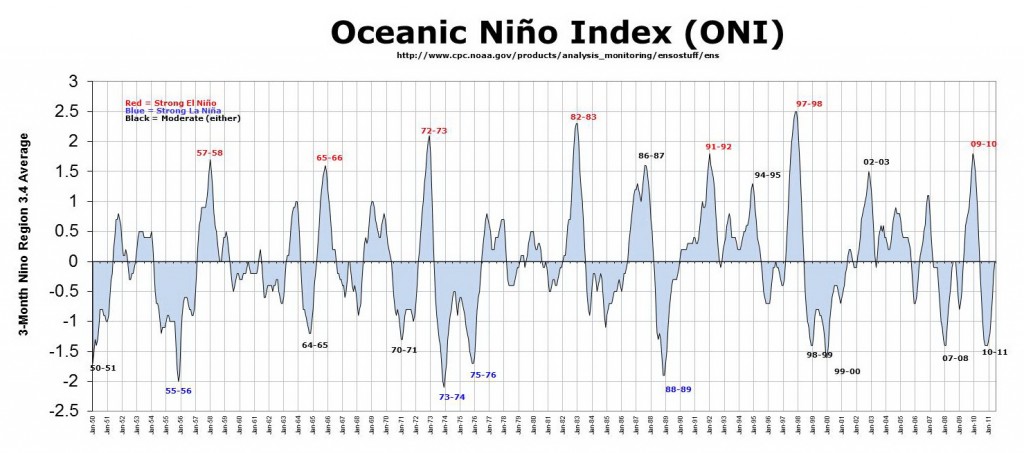
First and foremost this year will see La Nina conditions prevail in the Equatorial Pacific. Remember, La Nina means the sea surface temperatures in a certain part of the ocean are cooler than normal; El Nino means those same waters are warmer. You know what would actually make this pretty clear…AN MSPAINT MAP!!!
Although it may not seem like it, these departures from average thousands of miles from here have impacts on our seasonal weather and many would argue it’s the single biggest contributor to the sensible weather we’ll see this winter.
After much hemming and hawing this summer about where last year’s la Nina was heading, and a period where it really looked we where headed to the dreaded “La Nada,”(i.e. neither a nina or nino) it’s clear that this winter will be a La Nina winter and likely a “moderate” la nina winter. (Ninas and Ninos are classified as moderate, strong or weak depending on the sea temperatures departure from normal). If you recall last winter was also a moderate La Nina winter. This bears heavily into our analog year comparisons, because the “double dip” La Nina -i.e. two back to back la Ninas – is not common. Look:
As you can see, the last double dip was 2007-08 – 2008-09 and as you’ll read below, I believe 2008-2009 will be a great comparison to this winter. Other double dip years are 56-57, 72-73, 75-76, 99-00. Of these, 75-76, 99-00 and the aforementioned 08-09 seasons followed moderate La Ninas like this year. So when looking at la Nina years for comparisons, lean towards the SECOND la nina year as being more a more favored comparison.
2: NAO
Secondly, while la Nina is a great tool to assess the overall large scale pattern, the sensible weather in the northeast is also effected strongly by smaller scale teleconnections such as the Arctic Oscillation (“AO”), the Pacific North American Pattern (“PNA”), and the North Atlantic Oscillation (“NAO”). Of these the NAO is probably the most well known and may have the greatest effect on the weather in the northeast. A negative NAO pattern favors below average heights (AKA cold weather) across the northeast. Last season, we saw this play out to the extreme as the VERY strongly negative NAO dominated and displaced cold air where it wasn’t expected. (See the sustained six week stretch of dead winter from Jan 1 to Feb. 15.) In a La Nina pattern that sustained cold throughout the northeast is VERY uncommon. While the NAO is subject to much greater variability than the ENSO state, we’ve been in a strongly negative NAO pattern for several seasons now and so I’m confident we’ll trend in that direction this winter.
3: PDO
There is a large, multi-year pattern called the Pacific Decadal Oscillation (“PDO”). Essentially the PDO is a measure of north pacific sea surface temperatures and unlike La Nina or El Nino it’s a very long lasting pattern. In the cool phase it has been shown to enhance the effects of a La Nina pattern, enhance precip in the northwest/west, great lakes, and increase temperatures in the southeastern US. There is still a lot of science work being done on this pattern but I think it is very important to our weather. We’ve been in the cool phase for a while now and thus to really look at analog years you have to weigh years with the negative PDO pattern more heavily. Hence why I think looking at 2007-008 and 2008-2009 with the latter being weighted more, is the best play. I mean I’ve certainly incorporated ALL the analog years I could find in making this forecast, but sometimes you can get information overload and analysis paralysis. That’s really common with weather where there are countless variables, teleconnection indices and past weather data to look at.
So lets put some of this together using data from 2007-2008 and 2008-2009 as I think those are the best analog years with extra weight given to 2008-2009 under the double dip theory.
Northeast:
Lets take a gander at the snowfall from those years. We’ll use the Mt. Mansfield stake, J-Spin’s REALLY in-depth data collected in Waterbury, VT, and Mt. Washington data.
Looking at some analog years for the Mansfield Stake (yes I went past my 2007-2009 rules but it had to be done because of the inaccuracy of the Manny stake) we see the following for total snow depth:
and this is what we see for how that snow fell:
So excluding the “56-57 wtf was the weather thingy broken” year, we see similar years having average to above average snowfall. Interestingly in looking at how that snow fell we see clear spikes in storm size in December and February. Good to know.
Now lets turn to another GREAT data source. My man Jay keeps a snow reporting station with super accurate records at his place in Waterbury VT. While not perfect for measuring snowfall a few thousand feet up, over the years I’ve found it to be pretty damn accurate, albeit a bit low, for approximating the snow fall in the Northern Greens (and to a lesser but still reasonable extent) snowfall in the ADK.
So lets start with 2007-2008. This season was marked with a HUGE December (67.2 inches) and BIG February (54.7 inches) with an above average November (18 inches) and average March (33.3 -repeating of course- inches). The season hit its low point in January with a measly 27.6 inches of snow. Looking more closely at how this snow fell, we see the 5 biggest events as follows (these links loop weather maps of the events occurring so you can see the storms’ dynamics):
1. 19.2 inches (12/3/07-12/6/07)
2. 16.5 inches (12/16/07-12/17/08)
3. 16.4 inches (2/6/08-2/8/08)
4. 10.6 inches (1/1/08-1/2/08)
5. 10.2 inches (3/19/08-3/21/08)
With 53 snowfall “events” over all,roughly one measurable snowfall every 3 days, the season produced a grand total of 203 inches in Waterbury. Pretty damn good.
2008-2009 was another good year but overall not as great as 2007-2008. 176.6 inches of snow fell in 43 snowfall events. With 163 days of measurable snow on the ground, that’s roughly a snowfall event once every 4 days. Interestingly the season was marked with another very large December (55.9 inches) and above average November (20 inches). However instead of a large February, 2008-2009 featured a a snowy January (50 inches) and also saw a very un-snowy march. EVEN MORE interesting is how the snow fell.
See the biggest events were:
1. 18.2 inches (2/22/09-2/24/09)
2. 15.2 inches (2/18/09-2/21/09)
3. 14.2 inches (11/20/08-11/23/08)
4. 13.4 inches (12/21/08-12/22/08)
5. 11.8 inches (1/28/09)
…and from 12/11 to 12/22 (Part 1, Part 2 and Part 3) almost 40 inches fell in a 10 day span with a weak warm-up in between.
So really when you look at it, you had one hell of an awesome 10 day stretch in December, and a 40 inch week in February, with another 90 inches spread over like 140 days. This stands in contrast a bit to 2007-2008 which had more events, fewer BIG weeks, and more steady pow accumulation. I think a blend of these patterns is in order.
The next thing I’m considering is how these events transpired. To do that I pulled the National Re-Analysis loops from PSU’s most excellent E-Wall and looked at all the storms from 2007-2009. (You can follow along by clicking the links in the above storms)
What did I see? Well mainly I saw two types of systems. First I saw a number of strong lows ride along a boundary that draped across central New England and spread snow and mixed precip into NE, with back-side upslope snows accounting for the biggest portion of the total snowfall. Secondly I saw a few upper level troughs that hung around and just used moisture, weak upper level divergence and lifting, along with orographics to produce steady snow for 10 days straight. I saw few coastal nor’easters and quite a few nasty “lakes cutters” and “dirty ridges.”
Just for kicks I also took a look at MTW’s recorded data. Here is what it told me: December 2007 and December 2008 were good snowfall months. February 2008 and 2009 were average with around 4 feet of snow each month. The rest of the seasons saw below average snowfall and average temps. The exceptions being Jan. 2008 which was just WARM on the rockpile.
Utah (and sorta the PacNW):
Wait – you thought I was limiting this to only the Northeast? Heck no! I find the weather in the Cottonwood Canyons in Utah infinitely awesome and compelling. And given that we have a leading operative based there, I can’t ignore it.
Using Alta as a proxy for the high Cottonwoods overall snowfall situation lets consider 2007-2008 and see what we see.
In 2007, Alta had a 701 inch season. Ho-Hum. BY month the totals were: October, 53, November 24, December 140, January 179, February 104, March 93, April 92.
Notable large snowfall events that season were as follows: 40 from 12/7 to 12/8, 40.5 from 12/18 to 12/21, 36 from 12/28-12/31, 27.5 from 1/7 to 1/8, 50 from 1/27-1/30, 40 from 2/1- 2/4.
Now, lets look at 2008-2009 where Alta had a 696 inch season. Excuse me while I kiss the sky. Monthly totals were 76 in November, 116 in December, 119 in January, 98 in February, 141 in March and 156 in April. Notable events were:
50 from 11/3 to 11/5, 50 from 12/22-12/26, 45 from 1/2 to 1/6, 40 from 1/24-1/26, 30 from 2/16 to 2/18, 68 from 3/22 to 3/26, 30 from 3/28 to 3/30, 50 from 4/1 – 4/4 and 40 from 4/15 to 4/16.
In looking at these systems I notice a few things. 1, the “big” storms occurred in a pretty similar synoptic set up nation-wide and were rather consistent in their density and duration. The major difference I noticed was that there were BIGGER events in 2008-2009, but also bigger gaps between the events. In 2007-2008 I saw a lot more steady snowfall with fewer “big” events. (Note if you ever hear me say “storm cycle” or “storm train” please punch me in the throat. Sometime this winter I’ll get around to explaining why I hate these terms). Given how I like 2008-2009 more, lets store this nugget in our pockets.
In other analog years I looked at there was a spread of total of snowfall. Several analog years saw substantially below average snowfall, while others saw above average snowfall. Given that Utah in general sees some of the lowest variability in snowfall from year to year and from the change from el nino to la nina you can only assume that the real low years were simply statistical outliers and not really indicative of some hidden pattern I can’t see. Of course I could be wrong, but the topography, location and simple mechanics of snow all say Utah shouldn’t get skunked. Like ever.
I also took a quick look at Mt. Baker Snowfall in 2007-2008 and 2008-2009. Yea…not too exciting.
So what does this all mean? Read on young padawan and yee shall see…
Laying Tracks
It’s funny, you move around all summer. Hiking, biking, and climbing. You make a lot of smiles, beautiful pictures, and wonderful memories. But, if you look back up at the mountain you’d be hard pressed to find any physical evidence that you’d just had a glorious day enjoying her presence. That is until Old Man Winter arrives and lays down a blanket atop the mountain. He turns the mountain into a heap of vertical and a blank canvas awaiting your signature.
We call the signature our skis leave Laying Tracks.
Figuratively, you can lay tracks each and every day by putting all your effort behind something. Giving all your gusto. But’s it’s just figurative. If you’re picking up what I’m putting down?
Literally, you can only lay tracks on a few mediums. SNOW is the best of them. When you’ve just schussed your way down the hill, and you look over your shoulder, you can see exactly where you’ve been. It’s a whole different kind of gratification.
So, you want to lay some tracks? We’ll let us stoke your fire. Here’s to the first tracks of the Winter of 2011/12.
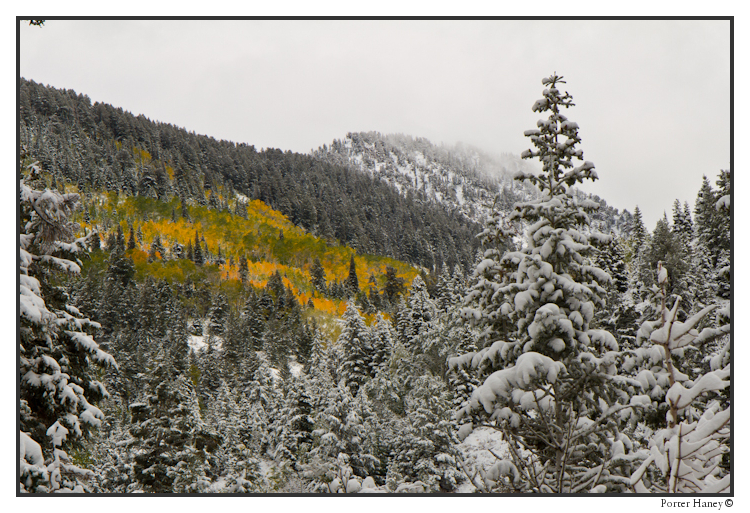
On my way around the corner towards the mountain I didn’t know if we’d be skiing foliage or snoliage. The hills answered my question for me.
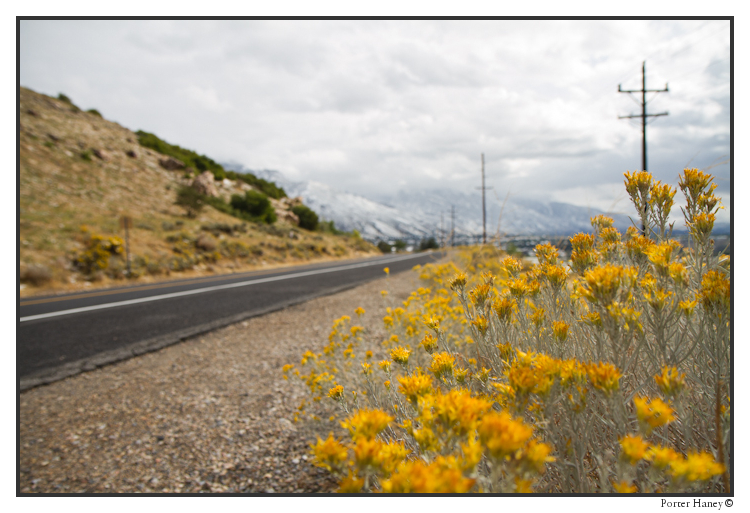
Getting a little further up the hill I was questioning whether the Aspen’s would have any of their golden hued leaves left. Again, the hills answered my question resoundingly. OUI.
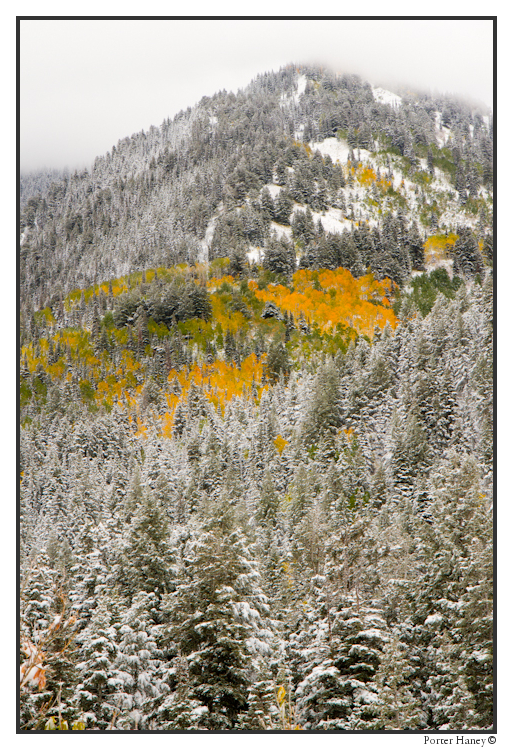
We pulled into the parking lot at the Collins Lift at Alta. It looked like the world donut championships had taken place. There wasn’t a tire track that aimed in a consistent direction. Pretty quickly Peters claimed, “I got my first faceshot of the season before you did!” He wasn’t lying either… too bad his windshield got the majority of the goods.
Our crew was large today, as it normally is on the first day of the season. The enthusiasm was infectious and our skinning crew was singing almost entirely up the track. Perry led the way, as it was his 25th Birthday, followed by Peters, Kate, Stew, Altman, and myself.
Perry’s the kind of guy to grab life by the horns, and shake it. And he did just that, on his 25th Birthday, he said no to switchbacks and laid some uphill tracks.
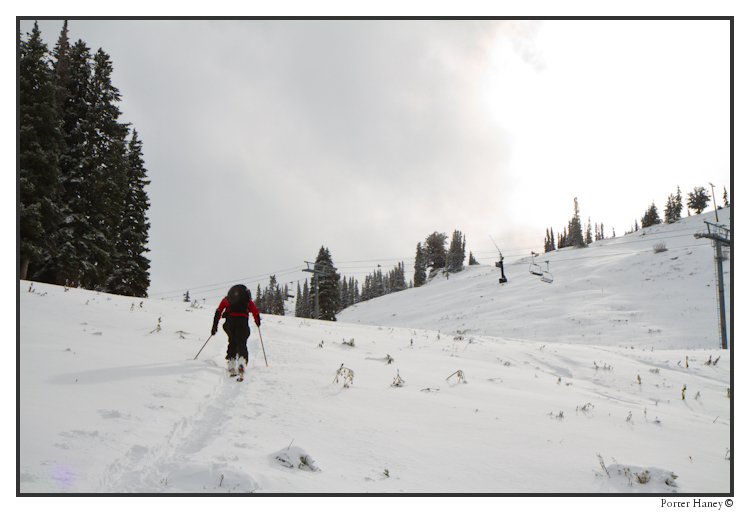
We scooted our way up the hill and to the top of the Collins lift. Home of the best low snow skiing in the Wasatch. We found grass slopes covered in nearly 2 feet of snow. We couldn’t have asked for better on October 6th.
Perry pulled Heady Toppers from the Alchemist in Waterbury and we proceeded to have one the most glorious Birthday celebrations I’ve ever been to.
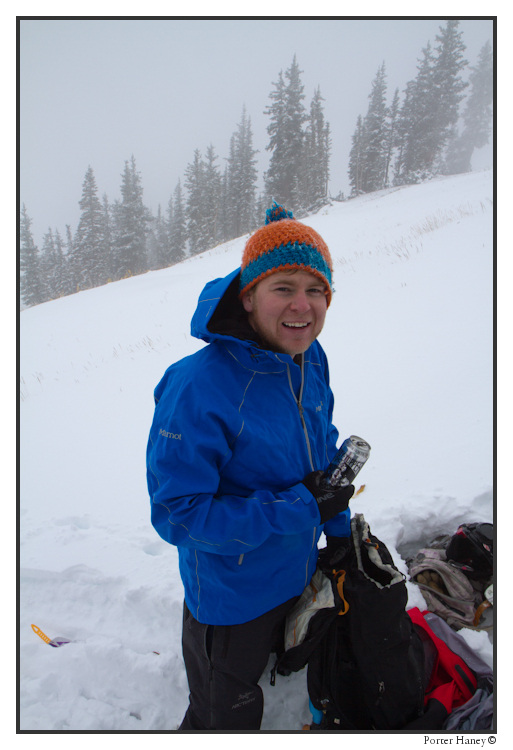
Well, enough celebration, lets get to the true gifts of this occasion. It wasn’t but three turns into the day that Perry gnabbed the first face shot of the season.
BEHOLD.
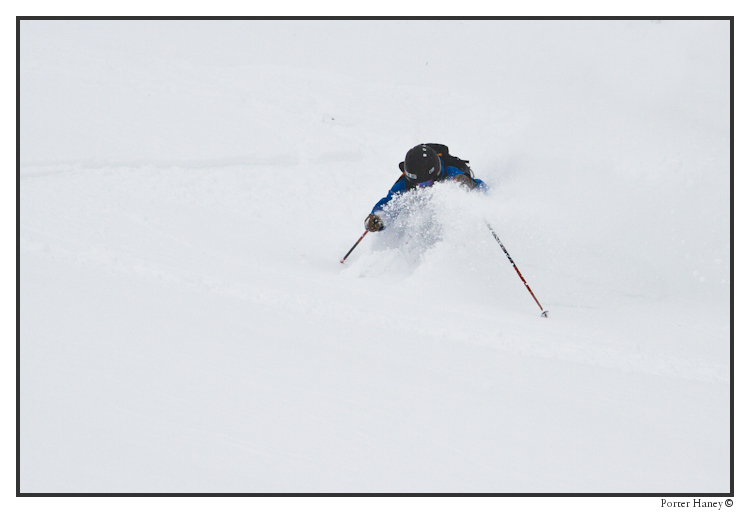
That kind of stoke isn’t without some celebration either. And, we got the biggest WOOO HOOO I’ve heard on the hill.
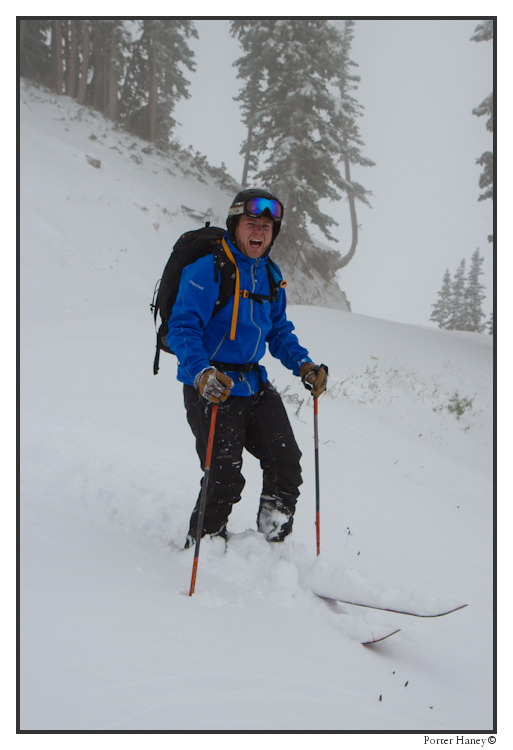
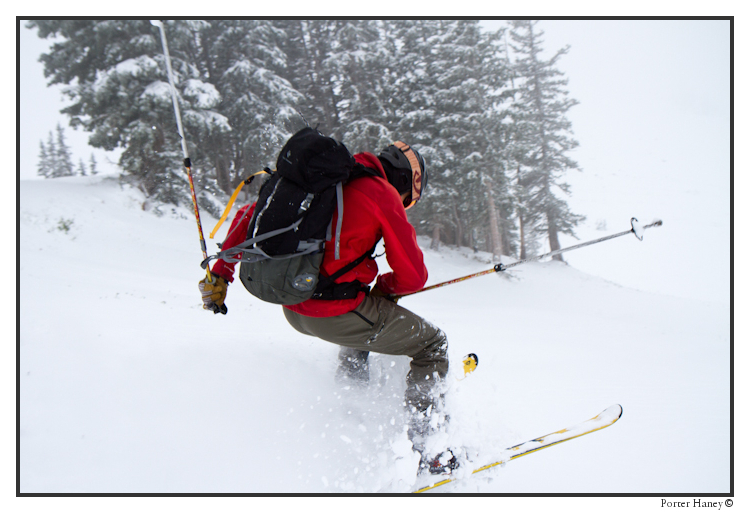
Peters came down the hill and he couldn’t quite get as deep as Perry. Though he tried.
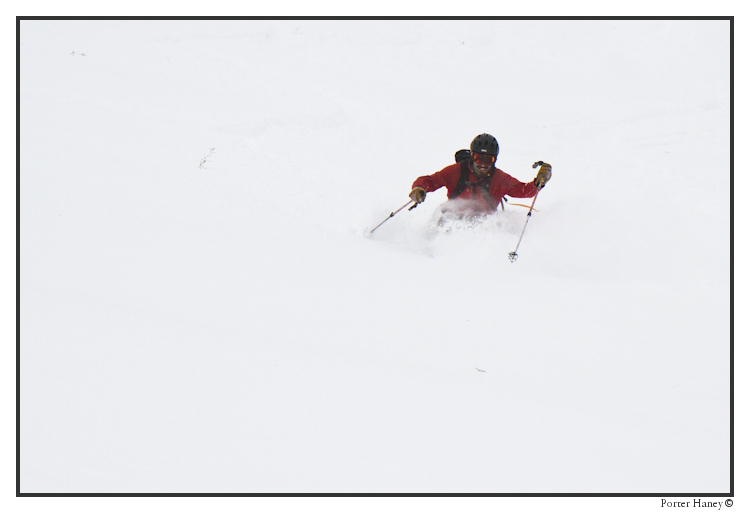
As repentance Ben burled into the stopping zone and jetted off the opposite side, pulling out the first Cossack of the season. (Though his left hand is noticeably didn’t make it around.)
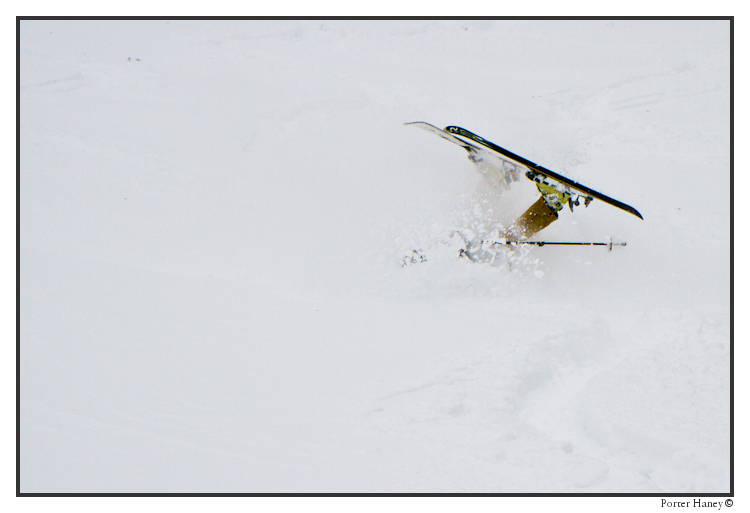
Kate busted down the hill next, and being the lightest of the group, just wasn’t getting as deep as she wanted. She pulled a radical early season manuever, and went for the ground mounted front flip! Low and behold, it worked.
A smile and two thumbs up were the only gesture apropos for this trip.
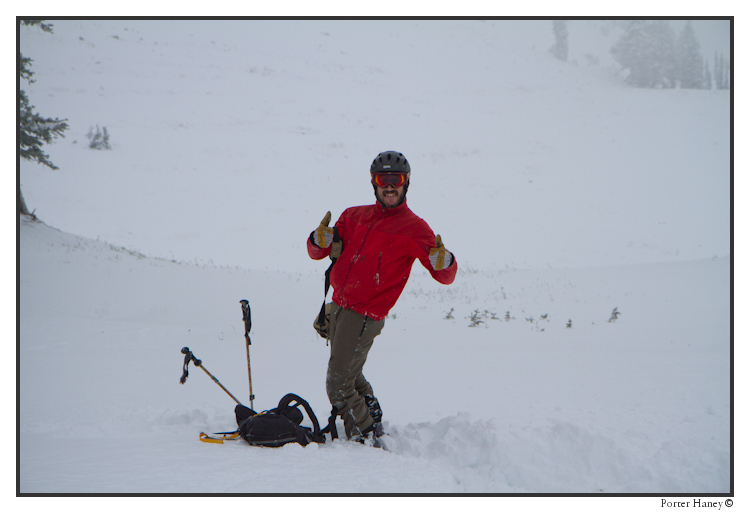
We headed off the hill with similar results, great snow and company. Celebrating a wonderful start to the 2011/12 season.
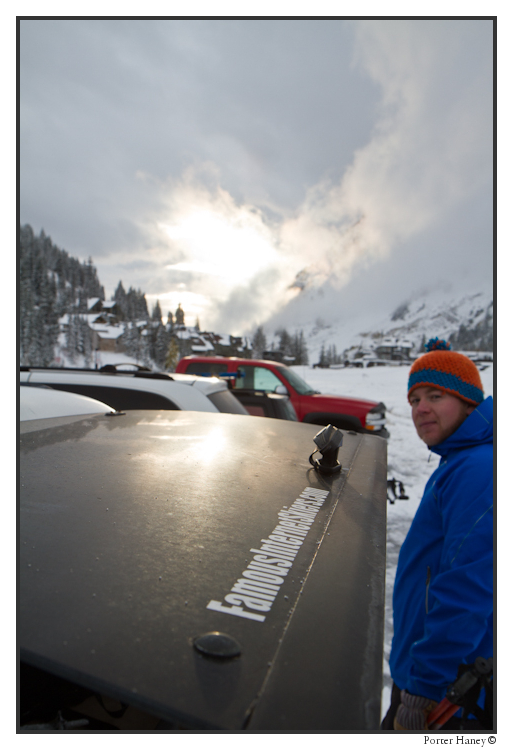
Cheers to laying your own tracks. Go get SUM.
TR: Consolation Prize
Depending on who you ask, going out and gawking at the Vermont Foliage is either a noble, or a useless endeavor. In any case trying to get nice pictures of the changing leaves is one of many things a skier can do while waiting for the snow to fly. Here’s a few of our pictures from going out and looking at the hills of Vermont just before the snow flies:
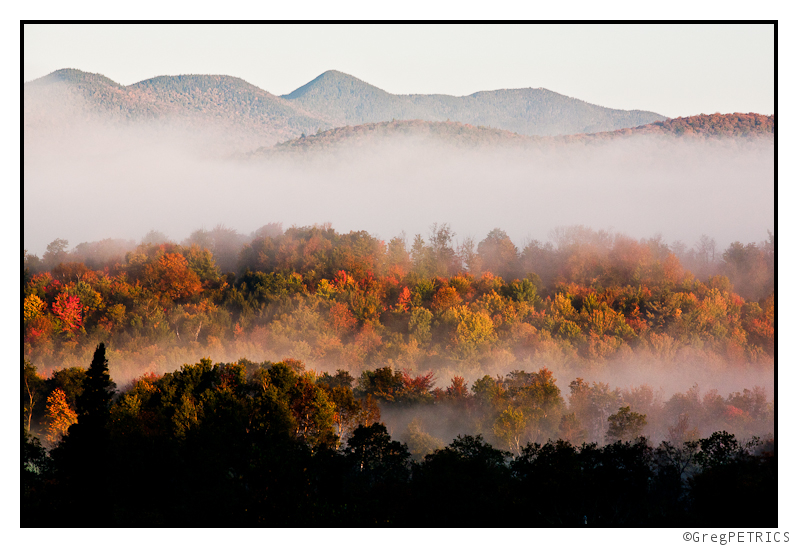
Click the picture or here to see all the pictures in Consolation Prize.
Snows? For Real? Like Shut-up! Srsly! OMG Get outta here….Ok maybe not. (UPDATED)
UPDATE:
Looks we are going to stay just too warm for this to produce any snows. System is going to take in a lot of maritime air, and the trough isn’t developing as it was previously modeled. Oh well. It happens. Only chance for snow now is in Western PA and West VA highlands. YEEEHAW….
OLDER:
Goddamn mother nature preempting the release of my winter outlook with the potential for schussable snow. WTF is her problem. Selfish, attention whore that she is. Doesn’t she know I come first? We’re going to talk this out at home later!
So with the usual caveats regarding unpredictability of early season snows lets talk about the CHANCE for some early season snows across the northeast.
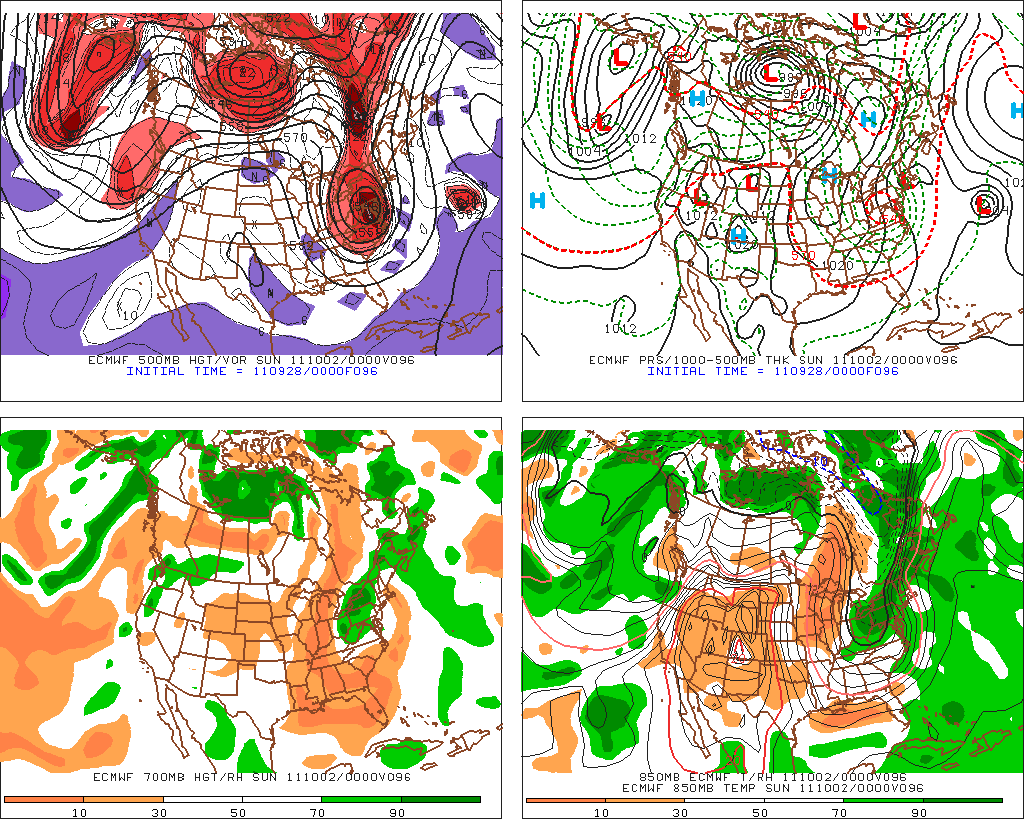
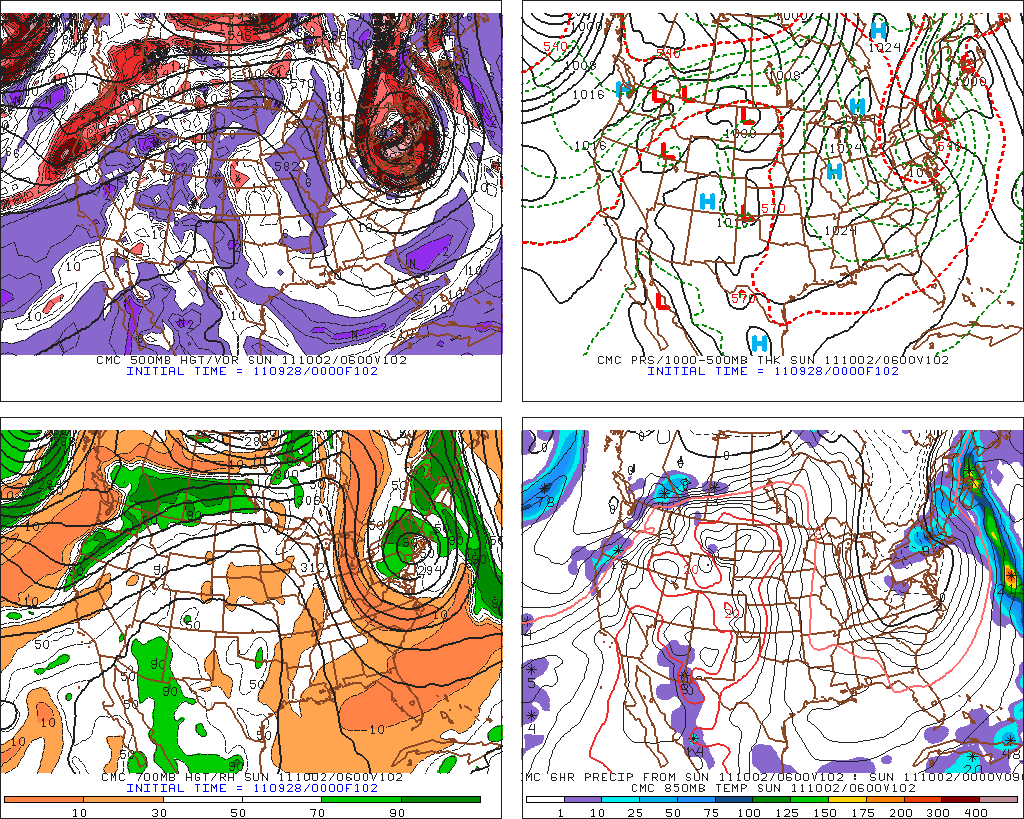
Simple story: all the major weather models are in agreement that as the pesky upper level low that has been centered in the Great Lakes, the flow around which has given us in the NE this shot of summer air, moves out, a trough and 500mb low will swing in from the NE.
The GFS, EURO and CMC all pretty much show the same thing:
GFS
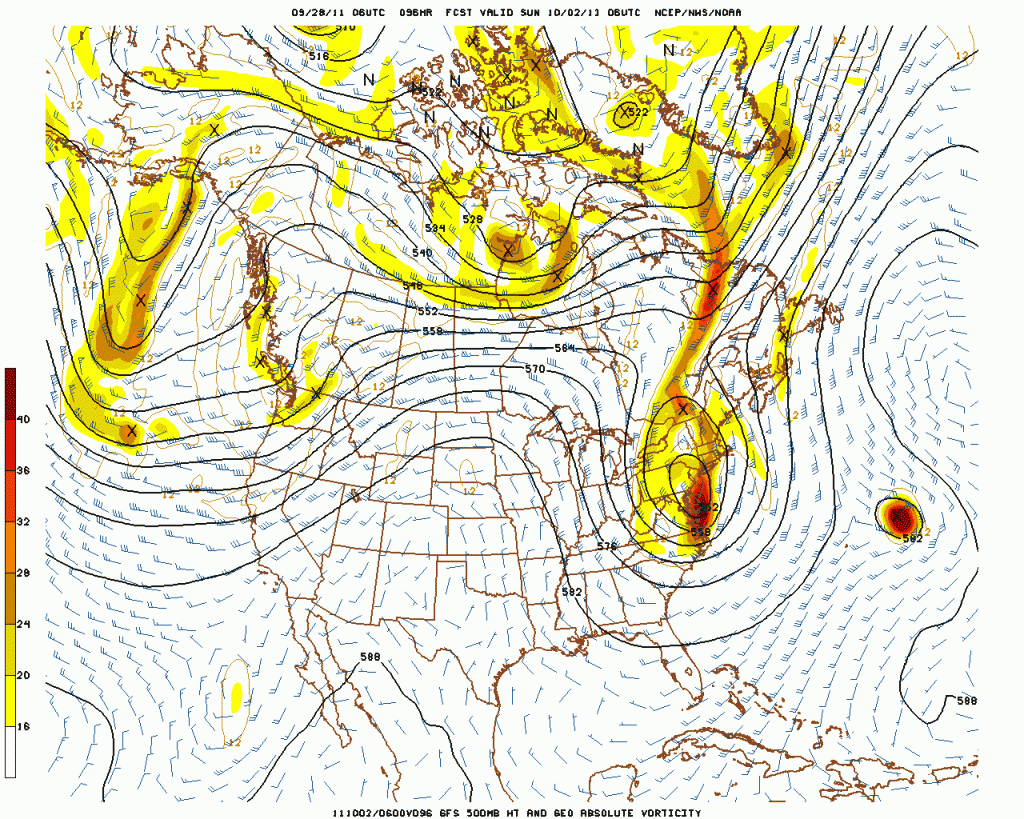
During this process, 850mb temps will fall to below 0c, and in some places below -3c.
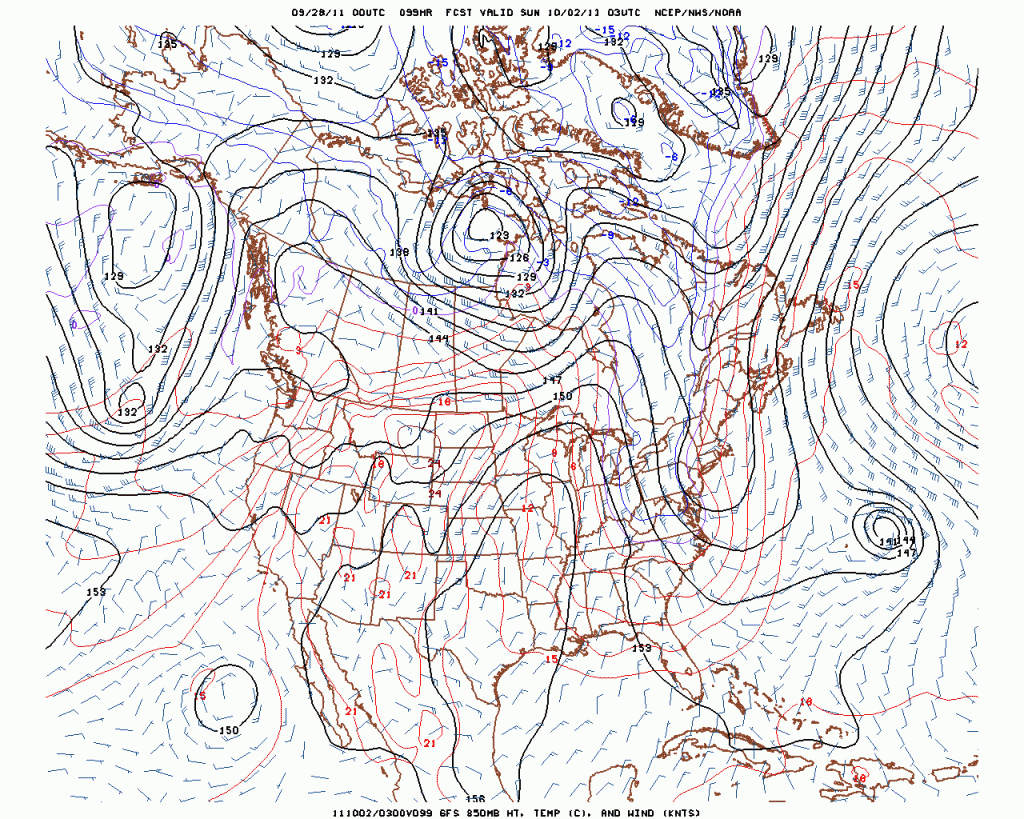
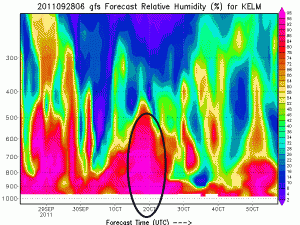
At the same time there will be a rather moisture rich enviornment throughout the NE.
Here is a cross section showing Relative Humidity for Burlington VT and then for the Catskill region (time period of interst circled in black)
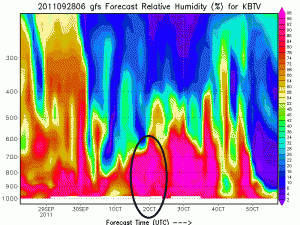
Ok so for some of you those images alone are enough to perk you up. But for those of you that don’t read weather models 10x a day, don’t know the name of the Rebel Leader on Hoth, and otherwise have a life let me point out a few things. First the moisture, resulting n/nw winds, upper level diverence will produce snow showers across the Cats, ADK and Greens sat afternoon into sunday. There is plenty of moisture, upward motion and cool air for this to occur. Amts will range from a “trace” to a few inches possible along favored locations.
Further to the south – in the cats, taconics, berkshires and southern greens things get slightly more interesting. As the upper level swings through, upper level mass divergece will spark enhanced upward lift over these regions. Enchance lift will lead to some enhanced precip. Models have conistently wanted to lolipop this region with something like .5-.75 inches of water over a 24 hour period. Given these facts I’d not be surprsied if somewhere in the Cats got a 6 inch snowfall over the higher terrain (3000+ft).
Now there have been overtures with this system to a Major snow storm around the same date in 1987. This storm dropped up to 2 feet of snow across the Cats, Taconics, and Berks. And while there are SOME similarities there is one large difference. The current storm isn’t forecasted to produce a strong surface low. In the october 1987 storm a large trough spun into the n/e and sparked cyclogenesis along a surface front. It was this surface low that really sparked the heavy snow. In fact the 1987 storm was actually, in my mind, much more similar to the October Nor’easter of 10/14-10/15 last year. This storm is not forecasted at this time to produce a surface low. As such I’d be surprised if it produces the same snow amounts.
Regardless, I’m pretty sure we’ll see some white coating across the higher terrain of the NE sunday morning. Since I by back and ass were soaked yesterday walking around BTV in what felt like early August- I’ll take this change.
I’ll update this somtime saturday morning when the high res models come out. Until then, like me on facebook, follow me on twitter, sign up to recieve my carrier pigeon drops, and for the love of god pick up after your dog. Of if you hate snow and all the fun stuff you can do on it, why not read about how to surf powvment–I mean, pavement–right here on FIS?!


