Weather blather for the Holidays: Cold (not coal) then what? UPDATED 12/18
Since I’ve gotten my xmas shopping done (Sorry kiddo, not every kiss begins with Kay….) I figured it was time take a look at the weather for next week as I’m sure many of you are wondering if you’ll get some powder under the tree this year (or menorah or Kinara -look it up- or aluminum pole).
Well the answer is…it appears unlikely that any significant snow will fall between now and Christmas day. Sorry!
READ POST ON WEEKEND SYSTEM FIRST IF YOU LIVE SOUTH OF LAKE GOERGE. POTENTIAL EXISTS FOR AREAS SOUTH TO GET REAL SNOW.
The polar vortex that is bringing us all this cold air is just too strong. It’s basically an upside down bowl sitting on top of the NE that (weather word) suppresses systems to our south and east. Along the edges of these bowls are where you’ll see storms travel and the core of the bowl will have the coldest air (big generalities there but I think you cats get the picture). Until the PV either moves west, rotates or bends like a banana we’re stuck with dry cold air.(On a related note pls see rant below).
The silver lining on all of this is of course that snowmaking can go gangbusters. Nothing that gets blown between now and xmas day is going anywhere. Combined with the low temps, low humidity and wet bulb temps resorts will not have to waste a ton of water to make good quantities of snow. Thus trail counts should rise in the next week.
Now the real interesting question is what does the weekend after Xmas bring. Right now all the cold air locked into the NE is like atmospheric TNT. The active southern branch of the jet stream is a flame. Get the two together and BOOM.
The question is when the flame meets the fuse.
Looking at the projected NAO, AO and PNA (go back a few months to get a better discussion of these features) values we see all indexes heading in similar directions at the same time.


You might be saying right now- hey wait a second- I thought we liked a negative NAO- why are you talking about it going positive. Well the answer is we get some great storms when the NAO flips from either pos to neg or neg to pos. The moving around of all that air is good for storms.
Based on the charts above we should be looking around day 8-12 for a storm system as the indices all change around that time.
Lo and behold here we go:
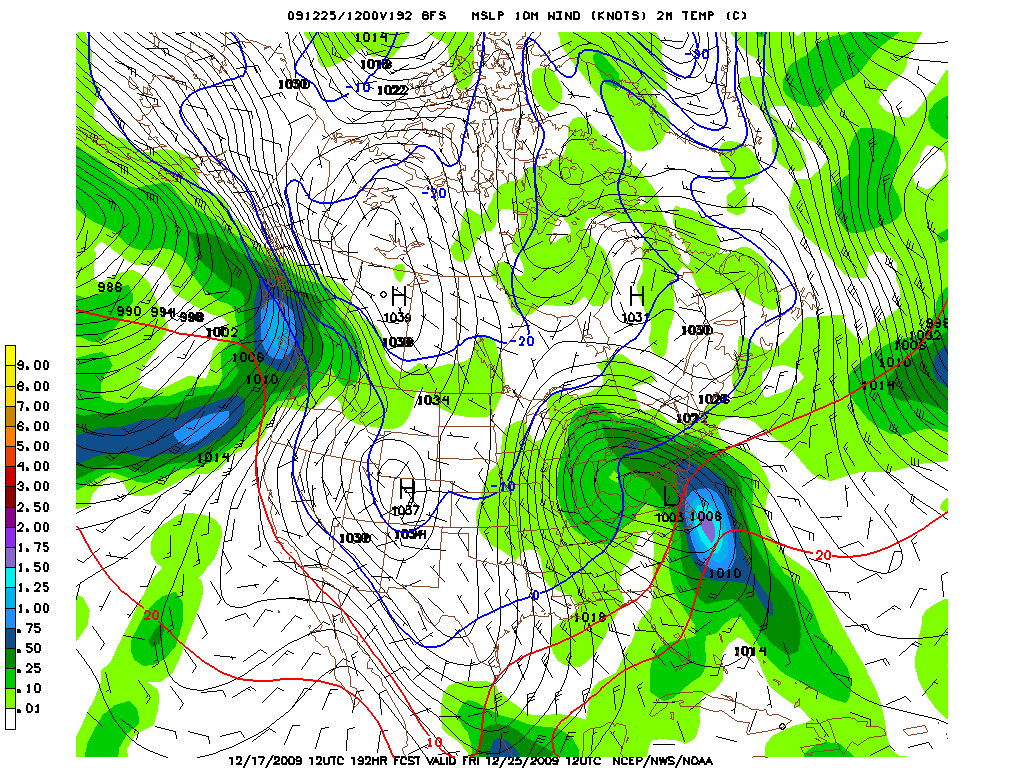
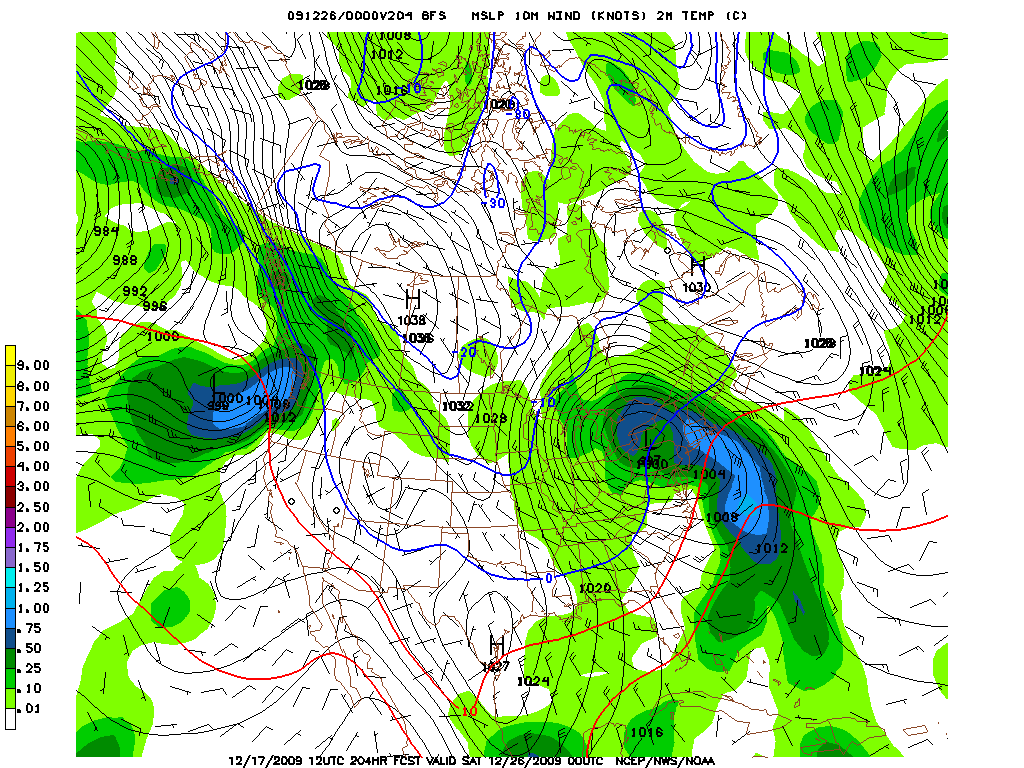
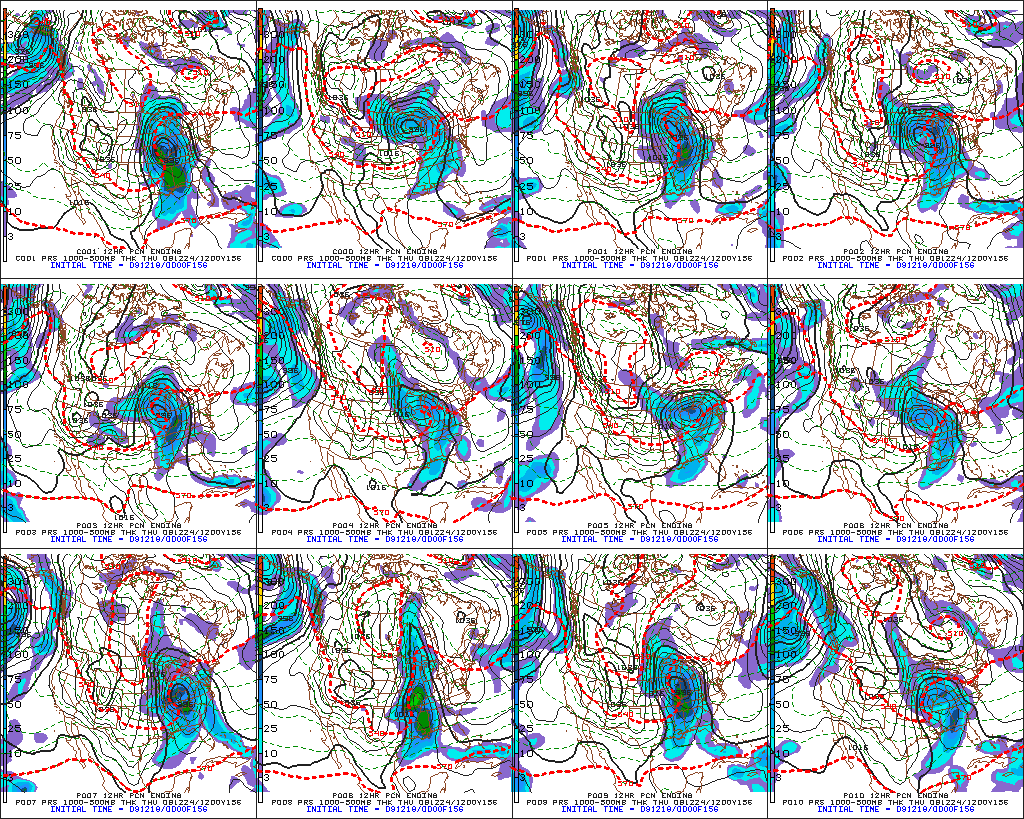
Looking at the 12z ensembles we see pretty good agreement this far out that something will be brewing:
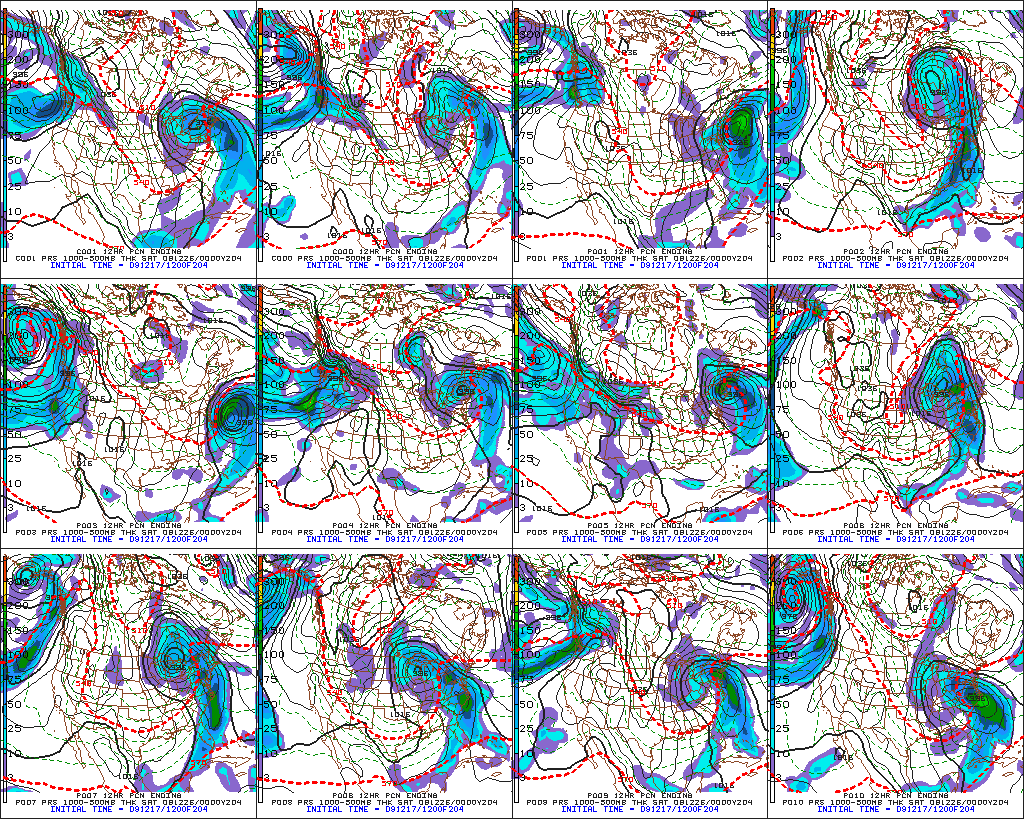
Before we start getting the orders in for Milk Bread and Eggs lets take a few seconds and consider a few factors.
1. Several model runs have show this storm developing in the four corners region and heading right into central Michigan. These are called “lakes cutters” and they usually bring us snow to rain to wrap around snow. Sometimes when storms take this path the tailing edge of their cold front spins up into a coastal system/spawns a coastal system/transfers energy to a coastal system. These can be referred to as “Miller B” storms. Miller B storms can rock or suck. Somewhere gets hammered. Somewhere gets rain. Somewhere gets dryslotted.
In the model runs of late we’ve seen a development of a more miller B type situation. In the current run I posted you can clearly see a coastal storm spawned from the system heading into Mich.
The coastal then tracks from Cape May to Buffalo (That’s def. not happening).
UPDATE: More on this “lake cutter” solution. Strong agreement on the long range ensembles that we’re going to deal with a storm that slides into the great lakes.
Here is the Canadian Model:
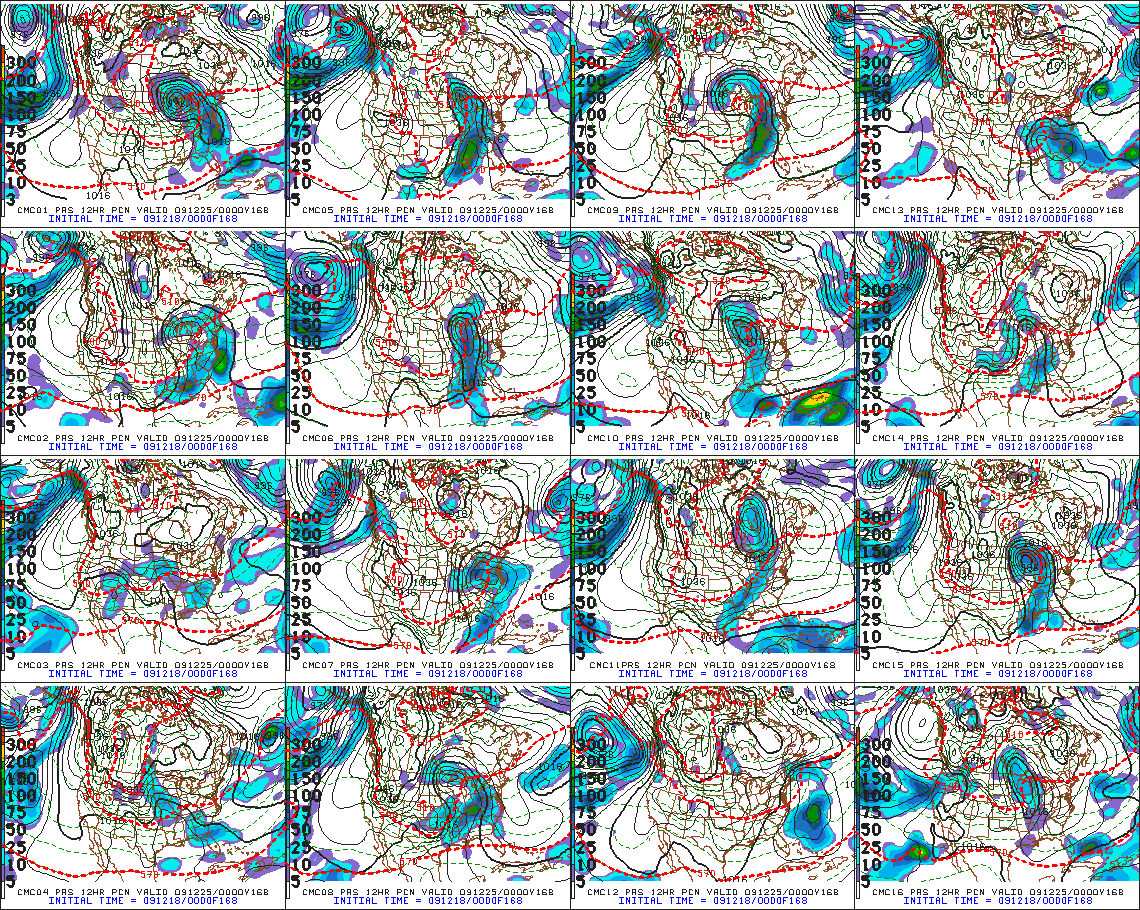
Here is the GFS:
2. When the NAO flips to pos I’m always wary of cutters. Why? I don’t know. It’s just me.
3. Feels somewhat like the last storm we had….you know the one that thumped us with front end snow and then lake effect. Why? Because I see a wet warm front riding over deep cold air while a coastal spins up in time to dryslot areas that got snow and keep the rain at bay. Whether this happens or not…who knows. It’s a week away!
4. Weather people smarter than me have said this looks a great deal like the 12/10-12/11, 1992 system. I remember this a sleety mess which was overshadowed by the March 1993 super storm.
Looking at the maps from this system there are some similarities. Namely:
The origin of the “primary low” (4 corners).
The path of the “primary” (N/Ne to Mich).
The presence of a trough in the NE prior to the system.
The development of a coastal system early on with a track slightly inland of the Del. coast.
So yea..there are some similar features. Does this mean the storm will develop the same way? Heck no. None of this even means that a storm will happen. Remember models are predictions based on current data. Change one digit and no storm!
What’s important to take away is that we have a pattern shift (might be very brief) and model agreement that the fuse might just get lit.
TIMEOUT FOR RANT:
We interrupt this programming to bring you a Lionelhutz rant. Sorry I can’t help myself here. You know how it’s commonly said “it’s too cold to snow…” and weatherman always say that this isn’t true. Well I think weatherman are stupid for saying that.
Sure, technically it can’t be too cold to snow because it’s not like water stops freezing when it gets too cold or moist air doesn’t rise. No matter how cold it is it can always snow based on phyisics, chemistry and hydrodynamics. But to rely on the strict science misses the point.
The term too cold to snow comes from the common situation in the NE that we are in now. Big artic highs settle over the NE and the combination of rising heights, steering winds, low dew points etc…steer storms away from the high. For the common person who sees like 4 weather facts a day (temp, precip, wind, sun) when it’s really cold it often doesn’t snow. When was the last time you saw snow when it was in the single digits. In philly that happened once in my lifetime- blizzard of ’96. As far as I remember that was pretty freakin epic. Short of that, the best storms usually have temps in the high teens to low ’20s. So since most people don’t look at 40 weather maps a day and understand the atmospheric pattern, the only way to express the pattern we are in now is – “it’s too cold to snow.” To call that wrong misses the point.
RANT END.
9 Comments
Leave a Reply
|
|||
| Home |





St. Bear
wrote on December 17th, 2009 at 5:12 pm“Along the edges of these bowls are where you’ll see storms travel and the core of the bowl will have the coldest air (big generalities there but I think you cats get the picture). ”
So if Northern New England is the core of the bowl, where does that put the edges? CT? NY? PA? Does this pattern shape up for storms for the Catskills?
Lionel Hutz
wrote on December 17th, 2009 at 5:59 pmRead latest post…and the answer is yea.
Harvey44
wrote on December 17th, 2009 at 5:33 pmI’ll take my chances with the Miller B. BRING IT!!
Vincenzo
wrote on December 17th, 2009 at 5:56 pmWhat models do you most commonly use for forecasting?
Lionel Hutz
wrote on December 17th, 2009 at 5:58 pmEuro, GFS, NAM, NoGAPs, CMC, SREF, WRF, BUFKIT, NARR(historical data), my own records that I keep…pretty much everything. Models are not the answer. They are graphical data that you have to interpret.
Vincenzo
wrote on December 17th, 2009 at 8:57 pmLionel,
the reason I ask is that I developed a website for a company that supplies weather models, and I’ve never had that deep of an understanding of the maps, just that they need them quick! I’m learning more here.
Lionel Hutz
wrote on December 17th, 2009 at 11:51 pmVincenzo,
The basic deal with the models is that the most useful websites are those that present all the various models and their vairous runs (0z, 6z, 12…) in one easy to move through format. That way you can compare the various model solutions and trends. No one models is really better than another. It’s about consistency and trends w/r/t other models. What you created was it called and “e-wall”? That’s a common term for these weather websites.
Vincenzo
wrote on December 17th, 2009 at 11:56 pmLionel,
They have their own mapping software to map out those runs using the same data everyone else gets. The site we built allows users to quickly access the latest runs, loops, etc from basically every model you named.
i guess you can call it a wall on some pages, as it lays out the hourly imagery in columns. we use ajax to update the page as the runs are done and built.
its mostly for traders, so they need the maps quick. but thanks to reading what you do and my constant questions to the owner of the company, i’m trying to learn a little more about how cold/how much snow will be on chinclip when i get there! :D
Vincenzo
wrote on December 17th, 2009 at 11:59 pmHere’s what we built, but of course you won’t have access to the subscriber maps. It’s awfully expensive! http://tinyurl.com/yfo47cj